Modeling Clinical State, Signatures and Trajectories
The Problem
The translation of evidence from clinical trials of interventions to clinical practice often fails. In psychiatry, there are psychometric tools for measuring the clinical state for patients (e.g. in psychotic disorders, we might use PANSS or BPRS; in affective disorders, MADRS for depression and so on). In personalized medicine, (identifying interventions that work for specific patients using e.g. biomarkers), we want to identify which patients will, or might respond to an intervention. In trials, when the primary outcome shows no effect, researchers often resort to secondary outcomes that define sub-groups for further analysis; for example, take only patients with high positive symptom burden.
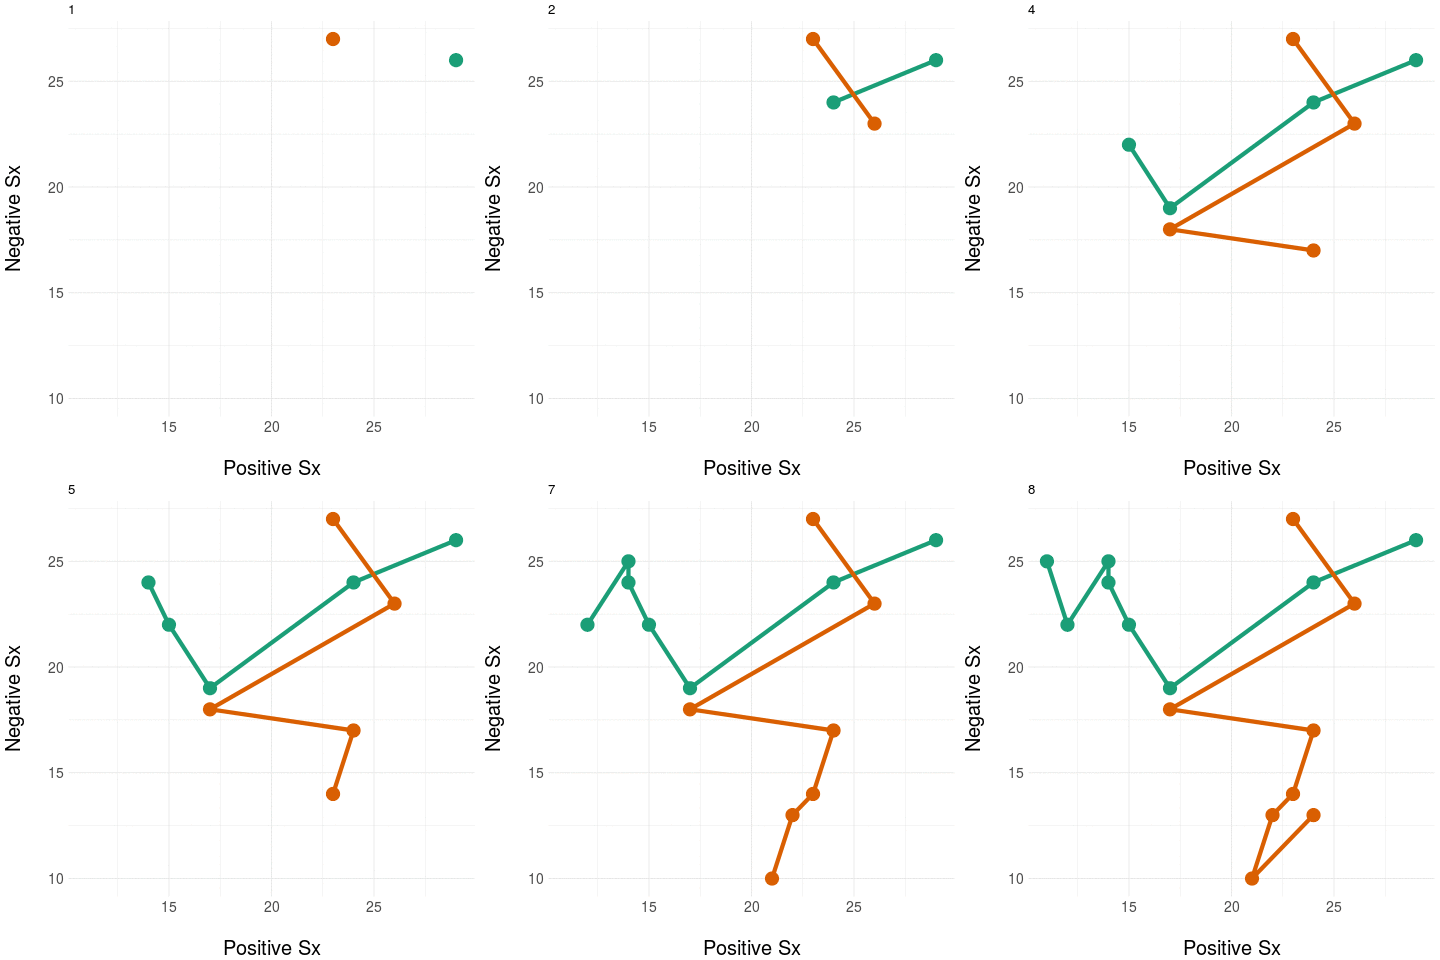
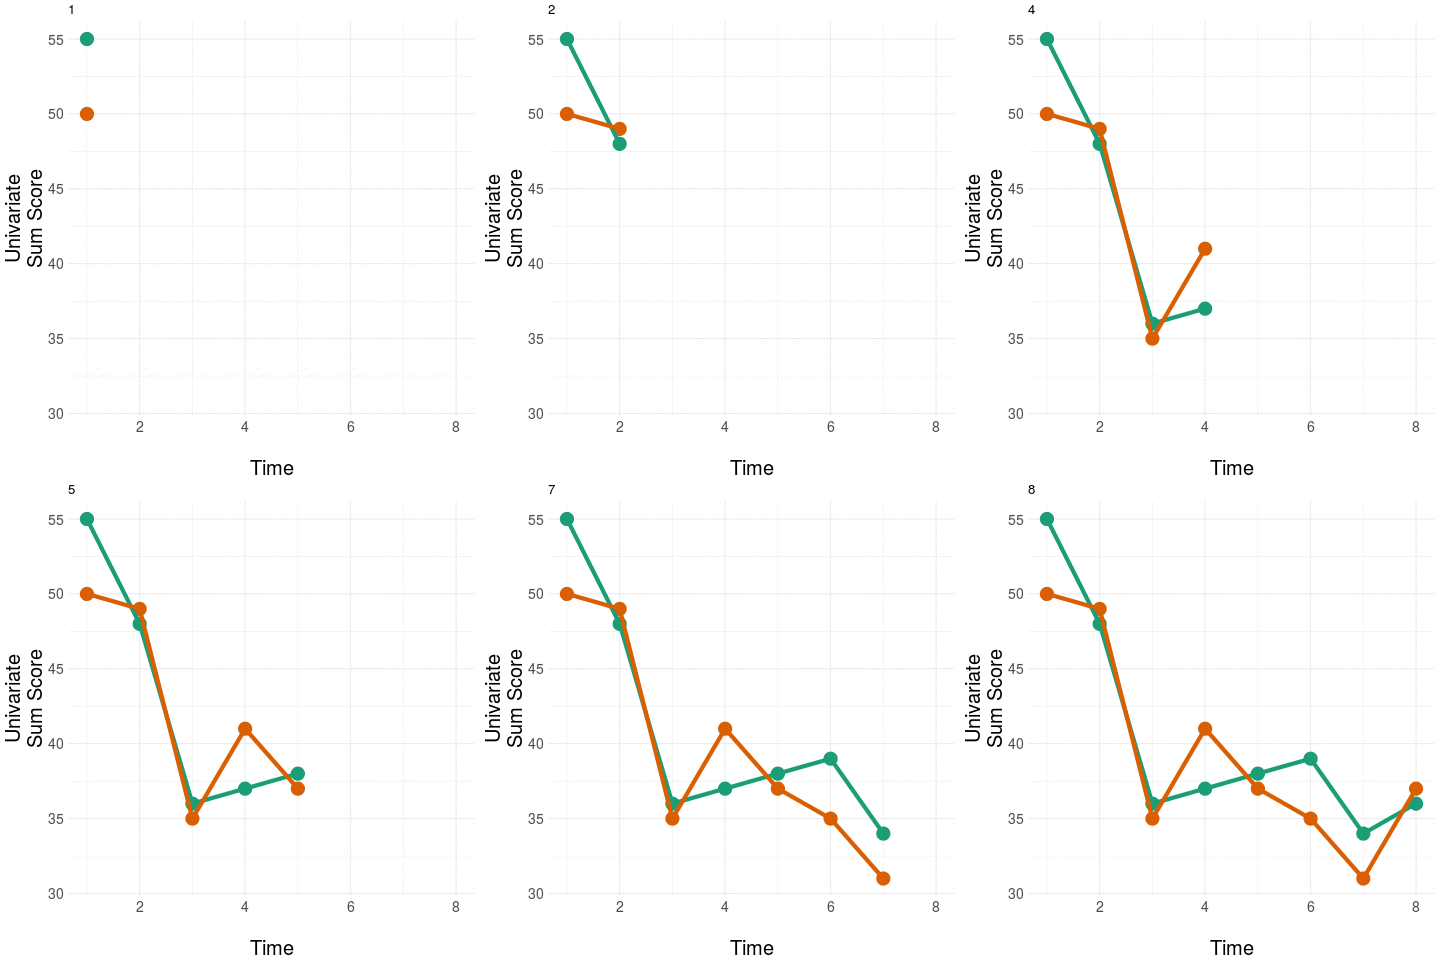
As an example, take two people at baseline and then measure only their positive and negative symptom load (using the PANSS instrument). Repeat these measurements during treatment.
The diagram on the left panel shows the trajectory in the plane. The graph on the right shows the same two patients collapsing the two-dimensional (2D) trajectory to a univariate (1D) aggregate measure - in this example, by simply summing the positive and negative domain scores. Notice that even though the two trajectories diverge in their native 2D space (at around the third time point), the univariate (1D) measure assigns them practically the same value, most notably at the final time point.
The message: collapsing data by weak aggregation results in loss of information about individual variation.
Modeling Outcomes
In a majority of clinical applications, we model clinical state as a univariate measure (y) most often as a simple sum. This weak aggregation (i.e. summation of the whole instrument) is made worse still, because we dichotomize y and designate this a binary outcome, z. We then try to find a model that maps the independent variables (X) directly to the dichotomized outcome z.
Essentially, from the features of the individual (X), we try and shortcut complex clinical state by assuming everyone with a diagnosis responds in the same way to a given intervention.
Information Loss
We can quantify the amount of information lost when forming weak aggregate measures for outcomes.
This graph illustrates what happens when we take the (native) 30 dimensional PANSS instrument, and vary the number of variables we collapse over. The horizontal axis (Subsets) are random allocations of PANSS items to a reduced space of 5, 10, 15, 20 ... dimensions.
As an example, the red line shows assignment of variables using the scheme above - where we collapse to only the positive and negative domains as a 2D representation of clinical state. The green line shows the same idea for the commonly-used "five factor" model of PANSS (where we aggregate the 30 PANSS items into groups arriving at a 5 dimensional representation for clinical state).
The vertical axis shows a unit-less distortion measure; essentially, for all people in the dataset, we record the difference between their pairwise distances in the native (30D) space and compare to the same pairwise distances in the reduced space. On the far right of this axis, when we preserve all 30 dimensions, there is naturally no distortion. Conversely, on the far left of horizontal access, the blue line represents the maximum distortion obtained when we collapse the whole PANSS instrument to a single univariate measure. Note the distortion approximately halves (like a power-law) when we move to using just a 2D representation instead of 1D (univariate) aggregation.
Proposal
We're working on ways to preserve the variation in (higher dimensional) clinical state to deriving strong aggregates that can be used as outcome measures. A sketch of the idea is illustrated below.
On the right, we again have the two trajectories but we add a "landline" that represents and anchors some feature of clinical significance or interest - here, we want to quantify negative symptom change. We measure the distance at each point on the trajectory to the "landline" and this becomes our univariate aggregate y - which is plotted on the graph on the right. Notice how the univariate measure shows a clear distinction between the two trajectories.
Naturally, any real anchor or landmark for clinically relevant states would be more complex than a simple 'line' (imagine, for example, a region delineated by a curve or some 'kernel' located in the space which weights the distances obtained).
Importantly, this idea of preserving as much clinical state information (in the native space) applies to any multivariate, high-dimensional measurement of state - be it a clinical scale (like PANSS, as we've used here for illustration) or tentative collections of biomarkers.
Further Reading
Some more elaborate thoughts on this problem are contained here and here.


